
|
 |
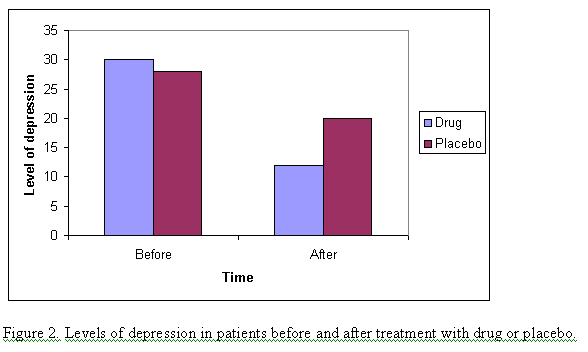
| |
|
|
|
|
Psychology Laboratory Report Writing |
7: Figures
Graphs are referred to as figures. Figures present graphical representations
of some or all of the data collected during the research that was undertaken.
A figure:
- Must have a title that is informative but concise. The title appears below
the figure.
- Has labels on the Y axes that clearly and unambiguously
indicate the scores (dependent variable measures) that are represented in
the figure.
- Identifies the experimental conditions and groups on the X axis or in the
graphed lines or bars. The decision about which way it is done depends on
what is thought to be the optimal representation of the pattern in the data
that the figure is designed to highlight, as the following line and bar graphs
show.
Different areas of psychology have different conventions concerning the presentation
of data in Figures. For example, standard error (SE) bars are generally expected
in animal studies. They are rarely seen in human studies.
-

NOTE: It is important to note that in psychology there
are conventions about the figures that are used for data representation, and
the conventions are, in general, different from the kinds of elaborate charts
that many word processing packages provide. As you will see by referring to
a good psychology journal, figures typically have an X (or horizontal) and
Y (or vertical) axis, and lines or bars are used as summary statements of
the collated data.
Ideally, a figure should:
- Stand independently of text;
- Be interpretable without reference to the text;
- Be accompanied by text that tells the reader how it should be read.
- Be introduced in the text before it appears. As soon as
possible after it appears, the text should then indicate to the reader how
to draw out the pattern in the findings presented in it.